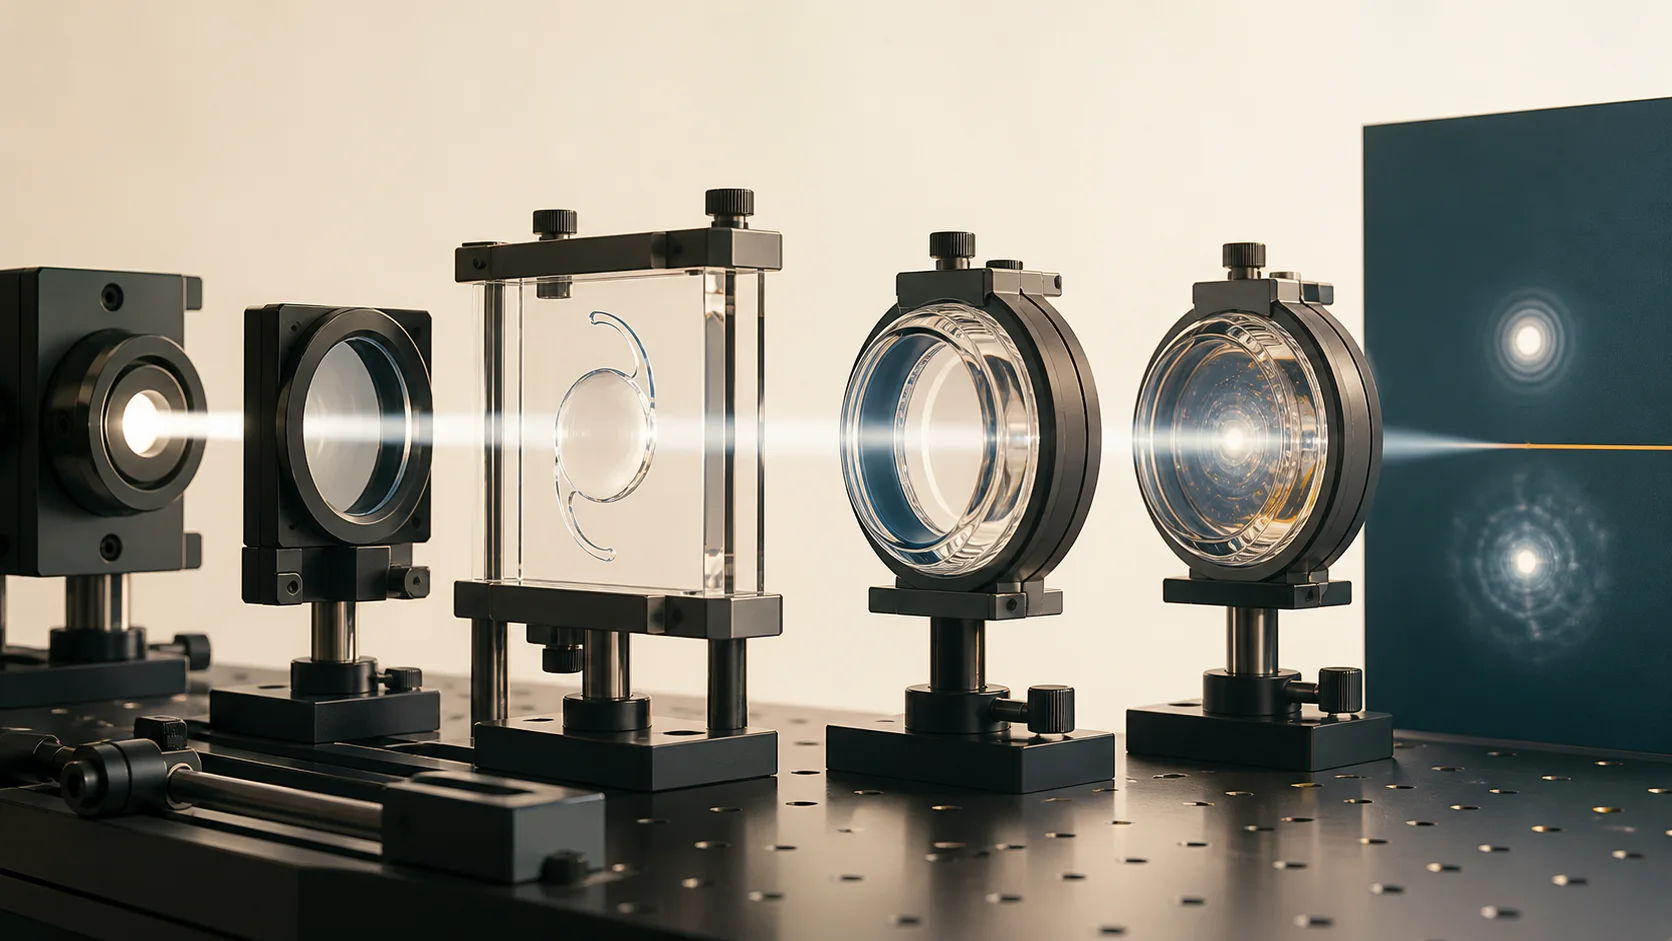
A lens can look excellent in one laboratory setup and less impressive in another without either result being false. Change the model cornea, pupil, light or measurement, and you may be asking the lens a different question.
This is why “tested on an optical bench” is useful information, but not a conclusion. Let’s look at how these tests work, what ISO2 and ACE actually mean, and where results from implanted patients must take over.
What happens on an optical bench?
The IOL is placed in a fluid-filled holder. A model cornea sits in front of it. Light passes through the cornea and lens, and a detector records the image produced at the other end.
Researchers can then change one condition at a time:
- the pupil opening;
- the colour or spectrum of light;
- the viewing distance or defocus;
- the position, tilt or decentration of the IOL;
- the model cornea placed in front of it.
This control is the strength of a bench test. If two lenses are tested in exactly the same setup, we can see a real optical difference between them without the noise created by different patients, surgeons and postoperative results.
But the control is also the limit. The result belongs to that setup.
What does MTF measure?
One of the most common results is MTF: modulation transfer function.
In simple terms, MTF shows how much contrast the optical system preserves as image details become finer. A higher MTF under the same test condition means that more of the original contrast reached the detector.
MTF is about the optical potential of the lens. It is not the same as a patient’s contrast sensitivity, because real contrast sensitivity also depends on the tear film, cornea, retina, optic nerve and brain.
It is also not enough to say that one lens had “higher MTF.” We still need to know: at which focus, spatial frequency, pupil size, wavelength and model cornea?
What is an ISO2 model cornea?
ISO 11979-2 is an international standard for testing optical properties of intraocular lenses. Standardisation matters because different laboratories need a repeatable way to measure the same product.
In many published ISO2 tests, the model cornea introduces +0.28 micrometres of spherical aberration. Spherical aberration is the difference between how central and peripheral rays of light focus. A real human cornea usually has some positive spherical aberration, while many aspheric IOLs are designed to compensate for part of it.
ISO2 therefore tests the IOL as part of a cornea-plus-lens optical system rather than as an isolated piece of plastic.
That is useful. It still does not make the setup a patient.
The ISO geometry is designed first for controlled, reproducible measurement. Some studies use one green wavelength; others use broader light conditions. Researchers may also choose different pupils, spatial frequencies and focus criteria. The words “tested in ISO2” do not tell you all of that.
What is the ACE model?
ACE stands for Average Corneal Eye.
The ACE model was developed to reproduce two average properties of the human cornea:
- spherical aberration;
- longitudinal chromatic aberration — the fact that different colours of light do not focus in exactly the same place.
This makes ACE especially useful when researchers want to test an IOL in white light and estimate how an average cornea and the IOL behave together.
So yes: if the question is how a lens may behave in an average human eye, ACE is generally more physiologically representative than one ISO2 setup. ISO2 gives laboratories a repeatable standard. ACE tries to reproduce more of the average human cornea, including the way different colours focus.
But the word “average” matters. ACE is still one centred model eye. It does not represent the full variation between real people.
ACE is not the same as 46 realistic eyes
This distinction is easy to miss in papers about TECNIS Eyhance and TECNIS PureSee.
Both research programmes used an average corneal eye for physical optical-bench measurements. They then added a separate computer-simulation step using 46 physiological eye models with realistic corneal aberrations.
Those simulated corneas included different amounts of spherical aberration and asymmetric imperfections such as coma and secondary astigmatism. The researchers could also test different pupil sizes and lens decentration.
So the accurate description is:
ACE bench testing plus a separate set of realistic computer eye models.
That is stronger than one average-eye measurement. It still remains preclinical evidence until the prediction is checked in implanted patients.
A result worth stating plainly: the model can change the apparent winner
A 2020 laboratory study tested TECNIS Symfony and AT LARA with two different ISO corneas.
With the aberration-free ISO1 cornea, AT LARA produced the better image in important conditions. With the positive-spherical-aberration ISO2 cornea, Symfony performed better overall.
At the larger 4.5 mm aperture, the primary-focus MTF values make the reversal impossible to miss:
- with ISO1, AT LARA measured 0.487 and Symfony 0.225;
- with ISO2, Symfony measured 0.437 and AT LARA 0.169.
The exact decimal is not the patient message. The direction is: change the model cornea, and the apparent winner changes with it.
The lenses did not change. The model cornea did.
This does not mean that bench testing is unreliable. It means that an IOL interacts with the cornea in front of it. The laboratory result answers a precise question: how did this lens perform with this model cornea under this test condition?
Marketing often removes the second half of that sentence.
This is also how a laboratory comparison can be “gamed” without anyone changing a number. Choose the model cornea, pupil, light or focus condition that suits one design, show only that graph, and a conditional result starts to look like a universal winner.
The graph may be technically correct. The impression it creates may still be misleading.
Why the laboratory cannot reproduce your vision completely
A real postoperative result includes factors that a basic model eye does not reproduce:
- your tear film and corneal surface;
- your own corneal aberrations and previous laser surgery;
- your pupil as it changes with light and age;
- residual short-sightedness, long-sightedness or astigmatism;
- the final position and centration of the IOL inside the capsular bag;
- optical scatter inside the eye;
- the health of the retina and optic nerve;
- the way the brain processes the image.
An optical bench also cannot ask whether you are comfortable driving at night, whether you wear reading glasses or whether halos bother you. Those are clinical and patient-reported outcomes.
Does this make bench testing useless?
No. It makes the wording important.
Bench testing is excellent for understanding an optical design, comparing lenses under identical conditions, detecting manufacturing problems and deciding which clinical questions should be tested next.
Some laboratory metrics can also predict average clinical visual acuity surprisingly well. In a study comparing bench measurements with clinical data from 243 patients, metrics that combined information across multiple spatial frequencies correlated strongly with the average clinical defocus curves.
But one MTF number at one spatial frequency was much less reliable, especially for a complex IOL. The same researchers also warned that a good prediction of the group average may not predict an individual patient.
That is the useful boundary: a validated model can estimate what may happen on average. It cannot tell you exactly how one eye will see.
Eyhance and PureSee show how a clinical bridge should work
The early Eyhance laboratory work used white-light ACE measurements and 46 realistic eye simulations. It predicted better intermediate vision than the standard TECNIS monofocal while maintaining similar distance performance. Comparative clinical studies later showed the same general pattern.
PureSee was evaluated with a similar sequence: average-eye bench testing, realistic computer models and then clinical studies. In the current FDA pivotal study, PureSee produced better intermediate vision and 0.64 D more depth of focus than the TECNIS monofocal control, while maintaining comparable distance acuity and contrast sensitivity.
The preclinical Eyhance and PureSee papers were supported by Johnson & Johnson Vision, and most or all authors were company employees. That does not invalidate the method, but it is one reason to look for the next step: independent replication and clinical confirmation.
This is how bench evidence becomes more persuasive. The laboratory predicts a specific result, and an implanted-patient study checks whether that result actually appears.
How to read an IOL laboratory claim
When you see a graph saying that one lens has better MTF or greater depth of focus, check five things:
- Which model cornea was used? ISO1, ISO2, ACE or another model?
- Were both lenses tested under identical conditions? The same pupil, light, focus, spatial frequency and lens power?
- Was the lens centred perfectly? Was tilt or decentration also tested?
- Is the graph one MTF value or the complete through-focus result? One peak cannot describe the full range of vision.
- Did a clinical study confirm the promised benefit? Look for implanted-patient visual acuity, contrast sensitivity, night symptoms and glasses use.
If those details are missing, the graph may still be technically correct. It is simply not enough to support a broad claim about daily vision.
The bottom line
ISO2 and ACE are not competing labels for “bad” and “good” science. They are different tools — but they are not equally close to the average human eye.
ISO testing gives laboratories a controlled and reproducible framework. ACE is generally more physiologically representative for estimating average-eye behaviour because it includes an average cornea and chromatic behaviour. A set of realistic computer eyes then tests whether the result survives some of the variation found in people. Clinical studies show what implanted patients actually experienced.
This is why an ISO2 (+0.28 μm) + Data on File graph is weaker evidence for a patient benefit than a programme that combines ACE, varied physiological eye models and clinical confirmation. It can still be useful engineering evidence. It is not the full answer.
The strongest IOL claim follows the whole route:
transparent bench condition → realistic simulations → clinical comparison → patient-reported result.
Stop after the first step, and you have useful engineering evidence. You do not yet have the full picture of human vision.
Questions to ask your surgeon
- Is the comparison you are showing me a laboratory result or a result from implanted patients?
- Were the lenses tested with the same model cornea, pupil and lighting conditions?
- What clinical data confirm the benefit for the task that matters to me?
Sources and evidence
- ISO 11979-2:2024 — Optical properties and test methods.
- Norrby S, Piers P, Campbell C, van der Mooren M. Model eyes for evaluation of intraocular lenses. Applied Optics. 2007.
- Alarcon A, Canovas C, Rosen R, et al. Preclinical metrics to predict through-focus visual acuity for pseudophakic patients. Biomedical Optics Express. 2016.
- Chae SH, Son HS, Khoramnia R, et al. Laboratory evaluation of the optical properties of two extended-depth-of-focus intraocular lenses. BMC Ophthalmology. 2020.
- Alarcon A, Cánovas C, Koopman B, et al. Enhancing the Intermediate Vision of Monofocal Intraocular Lenses Using a Higher Order Aspheric Optic. Journal of Refractive Surgery. 2020.
- Alarcon A, del Aguila Carrasco A, Gounou F, et al. Optical and clinical simulated performance of a new refractive extended depth of focus intraocular lens. Eye. 2024.
- FDA. Summary of Safety and Effectiveness Data: TECNIS PureSee, P980040/S176. 2026.